Multiple Choice
The following table shows the annual revenues (in millions of dollars) of a pharmaceutical company over the period 1990-2011. 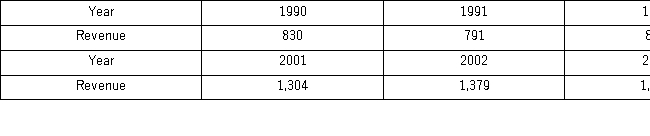
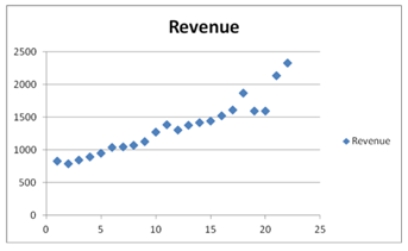 The Excel scatterplot shown indicates that the annual revenues have an increasing trend.Therefore,linear,exponential,quadratic,and cubic models were used to fit the trend,and the following relevant information became available after applying linear regression.
 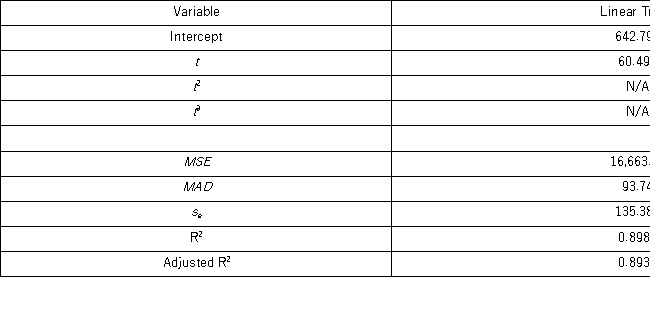 Which of the following is a revenue forecast for 2012 found by the exponential trend equation?
A) About 2 billion and 334 million dollars
B) About 2 billion and 189 million dollars
C) About 2 billion and 149 million dollars
D) About 2 billion and 34 million dollars
Correct Answer:

Verified
Correct Answer:
Verified
Q5: When the model y<sub>t</sub> = T<sub>t</sub> ×
Q20: Which of the following is a criticism
Q35: The _ of the adjusted seasonal indices
Q60: Noncausal forecasting models are purely time series
Q72: The following table includes the information about
Q74: Which of the following equations is a
Q74: In comparison with the linear trend model,
Q75: If there are T observations (y<sub>i</sub>,x<sub>i</sub>)to estimate
Q76: With the method of seasonal dummy variables,we
Q80: The following table shows the annual revenues