Multiple Choice
The following table shows the annual revenues (in millions of dollars) of a pharmaceutical company over the period 1990-2011. 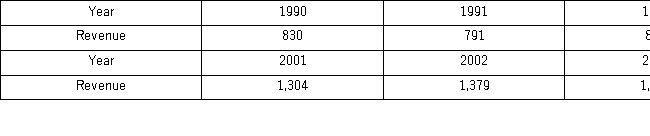
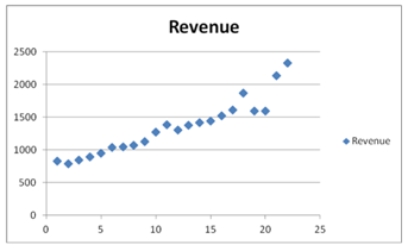 The Excel scatterplot shown indicates that the annual revenues have an increasing trend.Therefore,linear,exponential,quadratic,and cubic models were used to fit the trend,and the following relevant information became available after applying linear regression.
 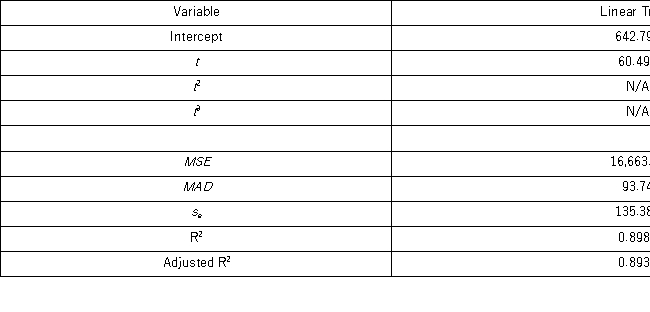 Which of the following is a revenue forecast for 2012 found by the polynomial trend equation with the best fit?
A) About 2 billion and 149 million dollars
B) About 2 billion and 189 million dollars
C) About 2 billion and 334 million dollars
D) About 2 billion and 34 million dollars
Correct Answer:

Verified
Correct Answer:
Verified
Q53: The exponential smoothing method weighs all available
Q57: The cyclical component of a time series
Q61: Based on quarterly data collected over the
Q63: When the increase in the series gets
Q65: Which of the following models is not
Q65: The past monthly demands are shown below.The
Q75: After we have estimated the trend and
Q95: A seasonal component differs from a cyclical
Q109: Which of the following is true of
Q123: A linear trend can be estimated using