Multiple Choice
The following table shows the annual revenues (in millions of dollars) of a pharmaceutical company over the period 1990-2011. 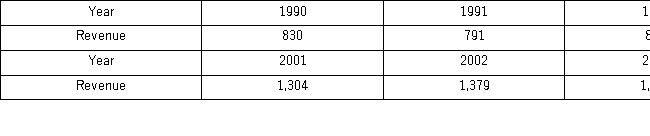
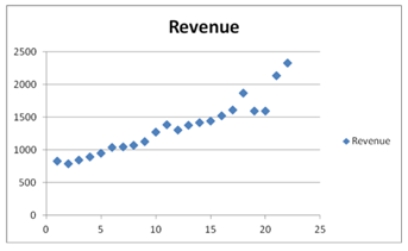 The Excel scatterplot shown indicates that the annual revenues have an increasing trend.Therefore,linear,exponential,quadratic,and cubic models were used to fit the trend,and the following relevant information became available after applying linear regression.
 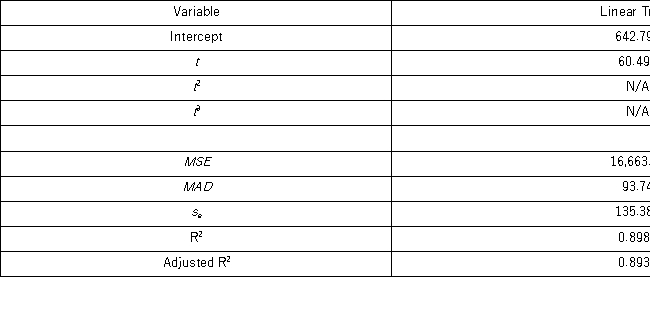 Which of the following is the revenue forecast for 2013 found by the trend regression equation with the best fit?
A) About 2 billion and 512 million dollars
B) About 2 billion and 95 million dollars
C) About 2 billion and 248 million dollars
D) About 2 billion and 290 million dollars
Correct Answer:

Verified
Correct Answer:
Verified
Q9: _ patterns are caused by the presence
Q34: When using Excel for calculating moving averages,
Q40: The following table shows the annual revenues
Q42: The following table includes the information about
Q46: All criteria used for selecting the best
Q47: Based on quarterly data collected over the
Q49: The following table includes the information about
Q50: The optimal value of the speed of
Q50: The following table includes the information about
Q115: Which of the following is a centered