Essay
The following table shows the annual revenues (in millions of dollars)of a pharmaceutical company over the period 1990-2011. 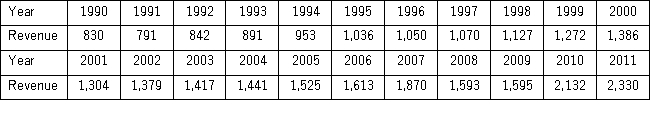 The autoregressive models of order 1 and 2,yt = β0 + β1yt - 1 + εt,and yt = β0 + β1yt - 1 + β2yt - 2 + εt,were applied on the time series to make revenue forecasts.The relevant parts of Excel regression outputs are given below.
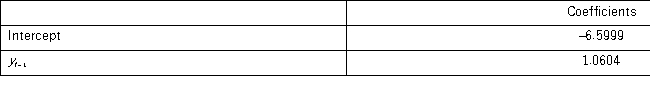
Model AR(1): 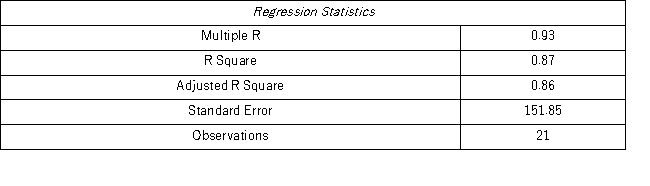
 Model AR(2):
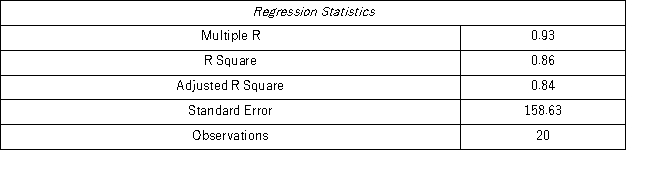
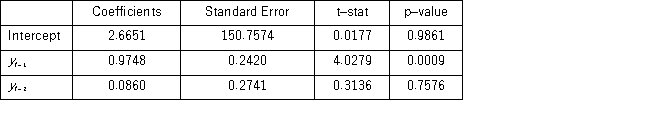 When for AR(1),H0: β0 = 0 is tested against HA: β0 ≠ 0,the p-value of this t test shown by Excel output is 0.9590.This could suggest that the model yt = β1yt-1 + εt might be an alternative to the AR(1)model yt = β0 + β1yt-1 + εt.Excel partial output for this simplified model is as follows:
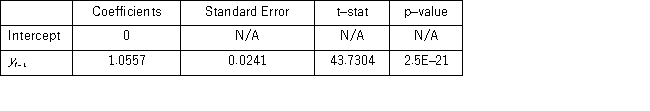 Find the revenue forecast for 2012 through the use of yt = β1yt-1 + εt.
Correct Answer:

Verified
The model is specified as yt = ...View Answer
Unlock this answer now
Get Access to more Verified Answers free of charge
Correct Answer:
Verified
View Answer
Unlock this answer now
Get Access to more Verified Answers free of charge
Q13: When comparing which of the following trend
Q76: Under which of the following conditions is
Q114: In the exponential smoothing formula for updating
Q115: The linear trend, <img src="https://d2lvgg3v3hfg70.cloudfront.net/TB4266/.jpg" alt="The linear
Q116: Based on quarterly data collected over the
Q117: The past monthly demands are shown below.The
Q118: Based on quarterly data collected over the
Q119: When the exponential trend model is used
Q123: When the decomposition model,y<sub>t</sub> = T<sub>t</sub> ×
Q125: If the model y<sub>t</sub> = T<sub>t</sub> ×