Essay
Quarterly sales of a department store for the last seven years are given in the following table. 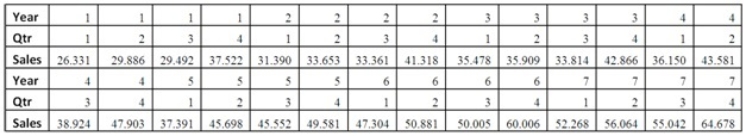
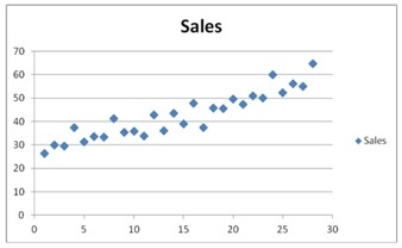 The Excel scatterplot shown indicates that the quarterly sales have an increasing trend and seasonality.Therefore,the linear regression model,Sales = β0 + β1Qtr1 + β2Qtr2 + β3Qtr3 + β4t + ε,with three seasonal dummy variables Qtr1,Qtr2,and Qtr3,and the decomposition method are proposed to make sales forecasts.For the regression model,the following Excel partial output is available.
 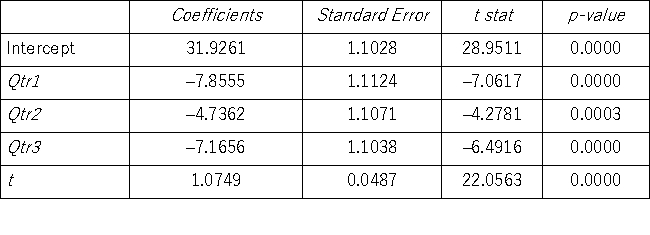 Using the regression equation for the linear trend model with seasonal dummy variables,what is the sales forecast for the first quarter of Year 8?
Correct Answer:

Verified
A linear trend model with seasonal dummy...View Answer
Unlock this answer now
Get Access to more Verified Answers free of charge
Correct Answer:
Verified
View Answer
Unlock this answer now
Get Access to more Verified Answers free of charge
Q65: The past monthly demands are shown below.The
Q68: When using Excel to calculate an exponentially
Q69: The following table includes the information about
Q71: Prices of crude oil have been steadily
Q72: The following table includes the information about
Q74: In comparison with the linear trend model,
Q74: Which of the following equations is a
Q75: If there are T observations (y<sub>i</sub>,x<sub>i</sub>)to estimate
Q109: Which of the following is true of
Q123: A linear trend can be estimated using