Multiple Choice
The following Excel scatterplot with the fitted quadratic regression equation illustrates the observed relationship between productivity and the number of hired workers. 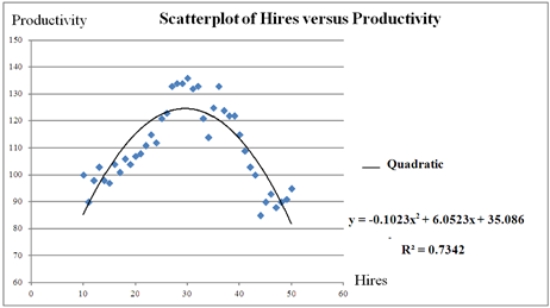 What is the percentage of variations in the productivity explained by the number of hired workers?
A) 85.69%
B) 0.7342%
C) 90.54%
D) 73.42%
Correct Answer:

Verified
Correct Answer:
Verified
Q44: The following data show the demand for
Q45: It is believed that the sales volume
Q46: The cubic regression model,y = β<sub>0</sub> +
Q47: The linear and logarithmic models,y = β<sub>0</sub>
Q48: A model with one explanatory variable being
Q50: For the quadratic regression equation <img src="https://d2lvgg3v3hfg70.cloudfront.net/TB4266/.jpg"
Q51: It is believed that the sales volume
Q52: It is believed that the sales volume
Q54: The following data,with the corresponding Excel scatterplot,show
Q99: What does a positive value for price