Multiple Choice
The following Excel scatterplot with the fitted quadratic regression equation illustrates the observed relationship between productivity and the number of hired workers. 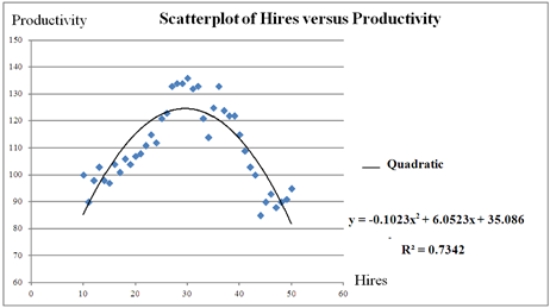 Which of the following is the predicted productivity when 32 workers are hired?
A) 124.00
B) 122.46
C) 121.60
D) 113.50
Correct Answer:

Verified
Correct Answer:
Verified
Q24: The fit of the models y =
Q105: For the model ln(y)= β<sub>0</sub> + β<sub>1</sub>ln(x)+
Q107: In which of the following models does
Q108: The scatterplot shown below represents a typical
Q108: In the model ln(y) = β<sub>0</sub> +
Q110: It is believed that the sales volume
Q111: It is believed that the sales volume
Q113: It is believed that the sales volume
Q114: Which of the following is not a
Q115: The quadratic regression model is appropriate when