Essay
The accompanying table shows the regression results when estimating y = β0 + β1x1 + β2x2 + β3x3 + ε. 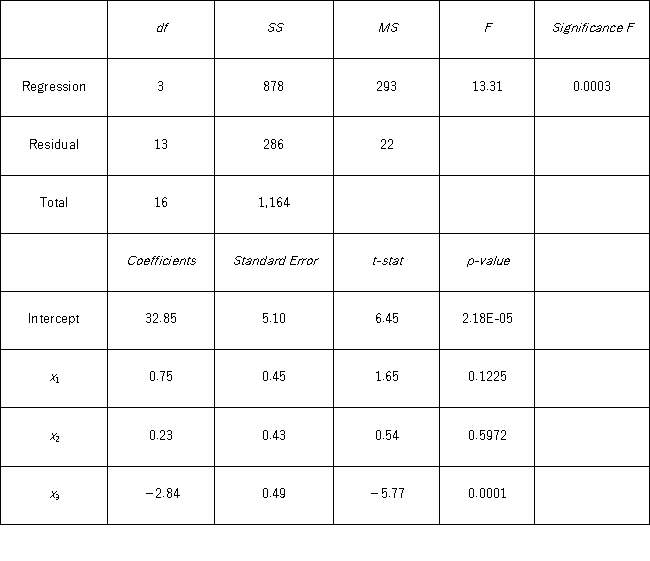 a.Specify the competing hypotheses to determine whether the explanatory variables are jointly significant.
b.At the 5% significance level,are the explanatory variables jointly significant? Explain.
c.At the 5% significance level,is x2 significant in explaining y? Explain.
d.At the 5% significance level,is the slope coefficient attached to x3 different from −2?
Correct Answer:

Verified
The competing hypotheses for the test wh...View Answer
Unlock this answer now
Get Access to more Verified Answers free of charge
Correct Answer:
Verified
View Answer
Unlock this answer now
Get Access to more Verified Answers free of charge
Q36: The term multicollinearity refers to the condition
Q40: When estimating a multiple regression model based
Q41: A researcher analyzes the factors that may
Q42: The accompanying table shows the regression results
Q43: A researcher studies the relationship between SAT
Q46: A sociologist wishes to study the relationship
Q47: The test statistic for testing the individual
Q48: If in the multiple linear model the
Q50: A sports analyst wants to exam the
Q121: The alternative hypothesis for the test of