Essay
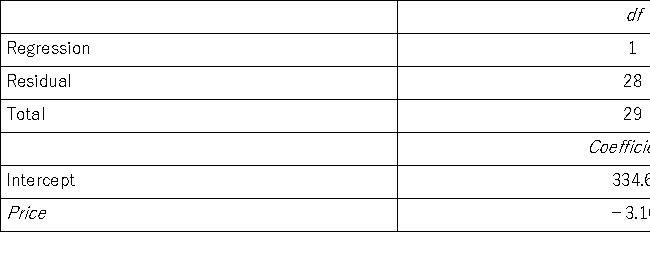
A researcher analyzes the relationship between amusement park attendance and the price of admission.She estimates the following model:  ,where Attendance is the daily attendance (in 1000s)and Price is the gate price (in $).A portion of the regression results is shown in the accompanying table.
  a.Predict the Attendance for an amusement park that charges $80 for admission.
b.Interpret the slope coefficient attached to Price.
c.Calculate the standard error of the estimate.If the sample mean for Attendance is 75.9,what can you infer about the model's predictive power.
d.Calculate and interpret the coefficient of determination.How much of the variability in Attendance is unexplained.
Correct Answer:

Verified
The regression equation is  .For each ex...
View Answer
Unlock this answer now
Get Access to more Verified Answers free of charge
Correct Answer:
Verified
View Answer
Unlock this answer now
Get Access to more Verified Answers free of charge
Q18: Assume you ran a multiple regression to
Q19: In the estimation of a multiple regression
Q20: Consider the following simple linear regression model:
Q21: The _ regression model allows us to
Q24: In the estimation of a multiple regression
Q26: The positive square root of the coefficient
Q27: The following portion of regression results was
Q45: The actual value y may differ from
Q115: When testing whether the correlation coefficient differs
Q125: If two linear regression models have the