Multiple Choice
In the following table,individuals are cross-classified by their age group and income level. 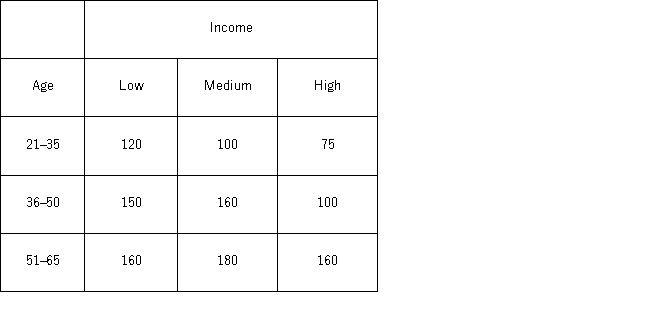 Using the p-value approach and α = 0.05,the decision and conclusion are __________________________________.
A) do not reject the null hypothesis;age and income are dependent
B) do not reject the null hypothesis;age and income are independent
C) reject the null hypothesis;age and income are dependent
D) reject the null hypothesis;age and income are independent
Correct Answer:

Verified
Correct Answer:
Verified
Q26: A university has six colleges and takes
Q27: In the following table,likely voters' preferences of
Q29: In the following table,individuals are cross-classified by
Q30: In the following table,individuals are cross-classified by
Q34: The following table shows the cross-classification of
Q35: The following table shows the distribution of
Q36: A university has six colleges and takes
Q37: Packaged candies have three different types of
Q102: For a chi-square test of a contingency
Q117: For the Jarque-Bera test for normality, the