Multiple Choice
The following frequency distribution shows the monthly stock returns for Home Depot for the years 2003 through 2007. 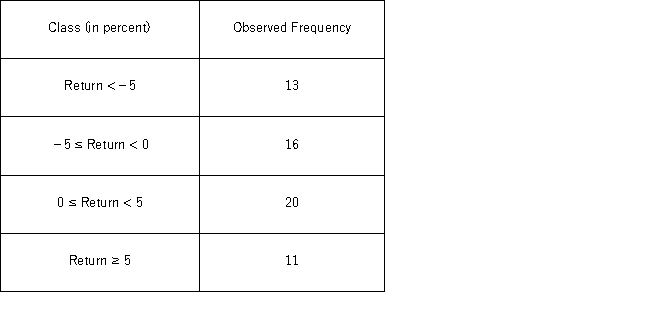 Over the time period,the following summary statistics are provided: Mean = 0.31%,Standard deviation = 6.49%,Skewness = 0.15,and Kurtosis = 0.38.For the goodness-of-fit test for normality,the null and alternative hypothesis are _________________________________________________________________________________________.
A) H0: The returns follow a normal distribution with mean 0.31% and standard deviation 6.49%;HA: The returns do not follow a normal distribution with mean 0.31% and standard deviation 6.49%
B) H0: The returns do not follow a normal distribution with mean 0.31% and standard deviation 6.49%;HA: The returns follow a normal distribution with mean 0.31% and standard deviation 6.49%..
C) H0: The returns follow a normal distribution with mean 0.31% and standard deviation 6.49%;HA: The returns do not follow a normal distribution with mean 0.31% and standard deviation 6.49%.
D) H0: The returns do not follow a normal distribution with mean 0.31% and standard deviation 6.49%;HA: The returns follow a normal distribution with mean 0.31% and standard deviation 6.49%
Correct Answer:

Verified
Correct Answer:
Verified
Q12: For the goodness-of-fit test, the sum of
Q42: MARS claims that Skittles candies should be
Q49: A card-dealing machine deals spades (1),hearts (2),clubs
Q51: In the following table,likely voters' preferences of
Q52: A fund manager wants to know if
Q53: The heights (in cm)for a random sample
Q55: Suppose Bank of America would like to
Q56: A researcher wants to determine if the
Q57: For a chi-square test of a contingency
Q59: Suppose you want to determine if the