Multiple Choice
The following frequency distribution shows the monthly stock returns for Home Depot for the years 2003 through 2007. 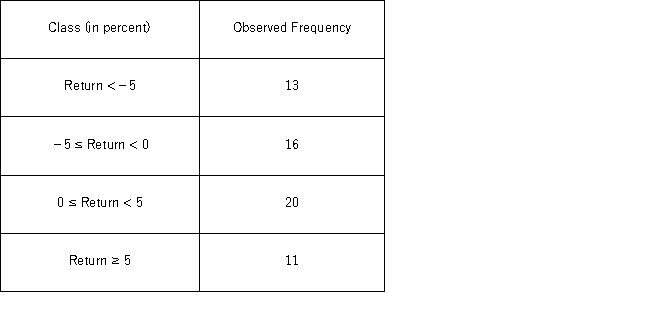 Over the time period,the following summary statistics are provided: Mean = 0.31%,Standard deviation = 6.49%,Skewness = 0.15,and Kurtosis = 0.38.At the 5% confidence level,which of the following is the correct conclusion for this goodness-of-fit test for normality?
A) Reject the null hypothesis;conclude that monthly stock returnsare normally distributed with mean 0.31% and standard deviation 6.49%.
B) Reject the null hypothesis;conclude that monthly stock returnsare not normally distributed with mean 0.31% and standard deviation 6.49%.
C) Do not reject the null hypothesis;conclude that monthly stock returnsare normally distributedwith mean 0.31% and standard deviation 6.49%
D) Do not reject the null hypothesis;conclude that monthly stock returnsare not normally distributed with mean 0.31% and standard deviation 6.49%.
Correct Answer:

Verified
Correct Answer:
Verified
Q2: For the goodness-of-fit test, the chi-square test
Q13: For a chi-square goodness-of-fit test,the expected category
Q15: The following table shows numerical summaries of
Q16: For a chi-square test of a contingency
Q18: For the goodness-of-fit test,the expected category frequencies
Q20: A manufacturer of flash drives for data
Q21: The following table shows the distribution of
Q22: In the following table,likely voters' preferences of
Q74: Suppose you want to determine if gender
Q116: What are the degrees of freedom for