Essay
The following table shows the observed frequencies of the quarterly returns for a sample of 60 hedge funds.The table also contains the hypothesized proportions of each class assuming the quarterly returns have a normal distribution.The sample mean and standard deviation are 3.6% and 7.4% respectively. 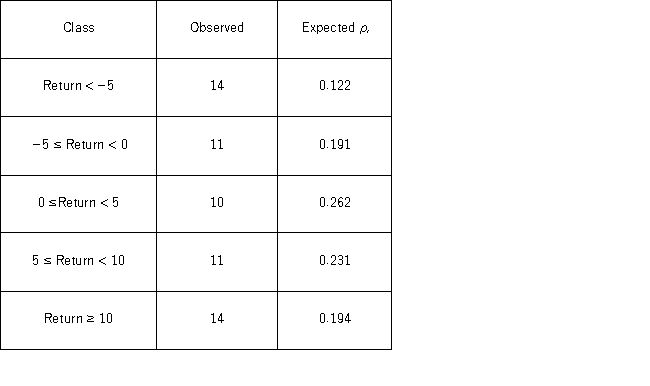 a.Set up the competing hypotheses for the goodness-of-fit test of normality for the quarterly returns.
b.Calculate the value of the test statistic and determine the degrees of freedom.
c.Compute the p-value.Does the evidence suggest that the quarterly returns do not have a normal distribution at the 10% significance level?
Correct Answer:

Verified
The null hypothesis for the goodness-of-...View Answer
Unlock this answer now
Get Access to more Verified Answers free of charge
Correct Answer:
Verified
View Answer
Unlock this answer now
Get Access to more Verified Answers free of charge
Q42: MARS claims that Skittles candies should be
Q57: For a chi-square test of a contingency
Q59: Suppose you want to determine if the
Q60: In the following table,likely voters' preferences of
Q62: For the goodness-of-fit test for normality to
Q64: The heights (in cm) for a random
Q64: The following table shows the distribution of
Q65: The following table shows the distribution of
Q66: A card-dealing machine deals spades (1),hearts (2),clubs
Q67: In the following table,individuals are cross-classified by