Essay
The following table shows the observed frequencies of the amount of assets under management for a sample of 134 hedge funds.The table also contains the hypothesized proportion of each class assuming the amount of assets under management has a normal distribution.The sample mean and standard deviation are 15 billion and 11 billion respectively. 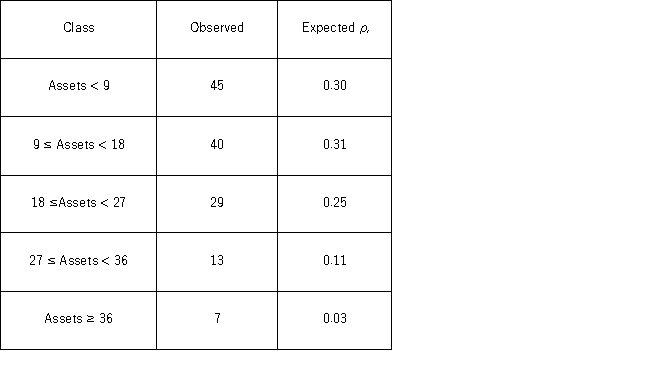 a.Set up the competing hypotheses for the goodness-of-fit test of normality for amount of assets under management.
b.Calculate the value of the test statistic and determine the degrees of freedom.
c.Specify the critical value at the 5% significance level.
d.Is there evidence to suggest the amount of assets under management do not have a normal distribution?
e.Are there any conditions that may not be satisfied?
Correct Answer:

Verified
The null hypothesis for the goodness-of-...View Answer
Unlock this answer now
Get Access to more Verified Answers free of charge
Correct Answer:
Verified
View Answer
Unlock this answer now
Get Access to more Verified Answers free of charge
Q12: For the goodness-of-fit test, the sum of
Q40: The following table shows the distribution of
Q42: The heights (in cm)for a random sample
Q43: A manufacturer of flash drives for data
Q43: For the chi-square test for normality, the
Q46: The airline industry defines "no-shows" as passengers
Q47: The heights (in cm)for a random sample
Q49: A card-dealing machine deals spades (1),hearts (2),clubs
Q58: For a multinomial experiment with k categories,
Q119: For the Jarque-Bera test for normality, the