Multiple Choice
The following table summarizes selected statistics for two portfolios for a 10-year period ending in 2006.Assume that the risk-free rate is 4% over this period. 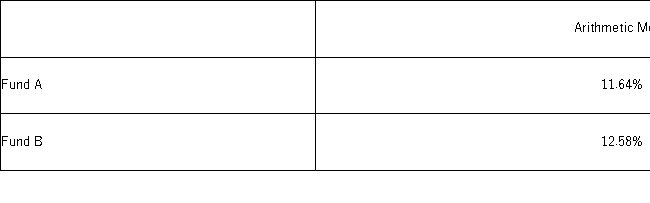 As measured by the Sharpe ratio,the fund with the superior risk-adjusted performance during this period is _________________________________________________________.
A) Fund A because it has a lower positive Sharpe ratio than Fund B
B) Fund B because it has a lower positive Sharpe ratio than Fund A
C) Fund A because it has a higher positive Sharpe ratio than Fund B
D) Fund B because it has a higher positive Sharpe ratio than Fund A
Correct Answer:

Verified
Correct Answer:
Verified
Q54: Amounts spent by a sample of 200
Q57: The following data represent the wait time,in
Q58: An investor bought common stock of Blackstone
Q59: The following gives summary measures for Google
Q60: Consider a population with data values of
Q61: The following is data a veterinarian collected
Q99: When applicable, the empirical rule provides the
Q117: Which of the following statements is most
Q124: The variance is an average squared deviation
Q147: The range is defined as _.<br>A) Q3