Multiple Choice
The following frequency distribution represents the number of hours studied per week by a sample of 50 students. 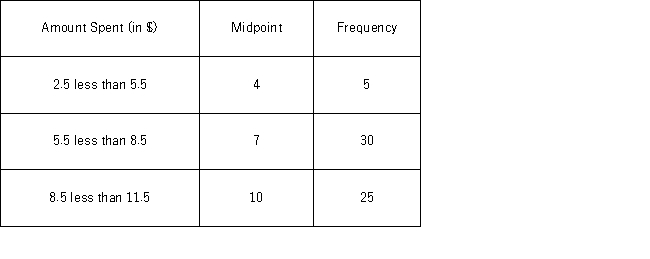 The mean number of hours studied is ____.
A) 7
B) 8
C) 22.8
D) 480
Correct Answer:

Verified
Correct Answer:
Verified
Related Questions
Q45: The z-score has no units even though
Q83: What is the relationship between the variance
Q98: What is(are)the characteristic(s)of the coefficient of variation?<br>A)
Q99: As of September 30,2011,the earnings per share,EPS,of
Q100: The table below gives statistics relating to
Q101: The director of graduate admissions is analyzing
Q102: The sample data below shows the number
Q106: An analyst gathered the following information about
Q108: The following is return data for a
Q133: Which of the following capabilities does Analysis