Multiple Choice
The Statistical Abstract of the United States,2010 provided the following frequency distribution of the number of people who live below the poverty level by region. 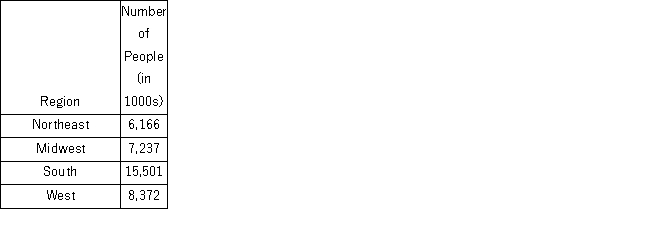 What is the percentage of people who live below the poverty level in the West or Midwest?
A) 35.96%
B) 41.87%
C) 41.58%
D) 31.96%
Correct Answer:

Verified
Correct Answer:
Verified
Q12: The following is a list of five
Q15: A car dealership created a scatterplot showing
Q16: A survey conducted by CBS news asked
Q18: The following table shows the percentage of
Q19: Students in Professor Smith's business statistics course
Q21: The following histogram represents the number of
Q30: Scatterplot is a graphical tool that is
Q75: A stem-and-leaf diagram is useful in that
Q108: For qualitative data, a frequency distribution groups
Q110: A pie chart is a segmented circle