Essay
Each month the Bureau of Labor Statistics reports the number of people (in thousands)employed in the United States by age.The accompanying frequency distribution shows the results for August 2011. 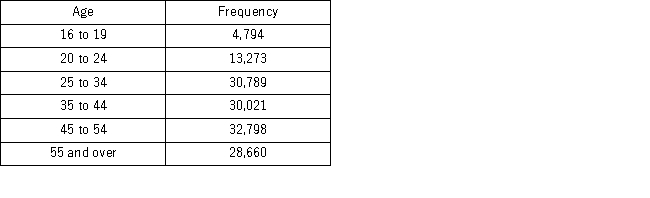 a.Construct a relative frequency distribution.What proportion of workers is between 20 and 24 years old?
b.Construct a cumulative relative frequency distribution.What proportion of workers is younger than 35 years old?
c.Construct a relative frequency histogram.
Correct Answer:

Verified
First find the total number of people su...View Answer
Unlock this answer now
Get Access to more Verified Answers free of charge
Correct Answer:
Verified
View Answer
Unlock this answer now
Get Access to more Verified Answers free of charge
Q32: The percent frequency of a category equals
Q39: The accompanying chart shows the number of
Q41: The _ is a graphical technique that
Q42: Construct a stem-and-leaf diagram for the following
Q43: What type of relationship is indicated in
Q47: Use the following data to construct a
Q79: An ogive is a graph that plots
Q84: How does an ogive differ from a
Q91: When displaying quantitative data, what is an
Q113: A polygon connects a series of neighboring