Essay
You have collected data from Major League Baseball (MLB)to find the determinants of winning.You have a general idea that both good pitching and strong hitting are needed to do well.However,you do not know how much each of these contributes separately.To investigate this problem,you collect data for all MLB during 1999 season.Your strategy is to first regress the winning percentage on pitching quality ("Team ERA"),second to regress the same variable on some measure of hitting ("OPS - On-base Plus Slugging percentage"),and third to regress the winning percentage on both.
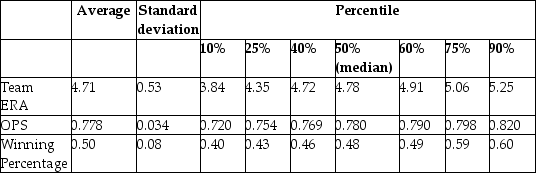
Summary of the Distribution of Winning Percentage,On Base plus Slugging Percentage,
and Team Earned Run Average for MLB in 1999
 The results are as follows:
  = 0.94 - 0.100 × teamera,R2 = 0.49,SER = 0.06.
(0.08)(0.017)  = -0.68 + 1.513 × ops,R2=0.45,SER = 0.06.
(0.17)(0.221)  = -0.19 - 0.099 × teamera + 1.490 × ops,R2=0.92,SER = 0.02.
(0.08)(0.008)(0.126)
(a)Use the t-statistic to test for the statistical significance of the coefficient.
(b)There are 30 teams in MLB.Does the small sample size worry you here when testing for significance?
Correct Answer:

Verified
(a)The t-statistics for team ERA and OPS...View Answer
Unlock this answer now
Get Access to more Verified Answers free of charge
Correct Answer:
Verified
View Answer
Unlock this answer now
Get Access to more Verified Answers free of charge
Q2: A 95% confidence set for two or
Q3: The critical value of F4,∞ at the
Q4: Consider the following multiple regression model<br>Yi =
Q6: In the process of collecting weight and
Q9: When testing the null hypothesis that two
Q10: Attendance at sports events depends on various
Q11: Consider the following two models to explain
Q12: Consider the following regression output for an
Q45: If the estimates of the coefficients of
Q47: Trying to remember the formula for the