Essay
You are presented with the following output from a regression package,which reproduces the regression results of testscores on the student-teacher ratio from your textbook
Dependent Variable: TESTSCR
Method: Least Squares
Date: 07/30/06 Time: 17:44
Sample: 1 420
Included observations: 420 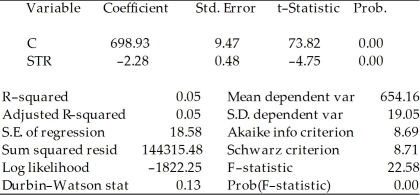 Std.Error are homoskedasticity only standard errors.
a)What is the relationship between the t-statistic on the student-teacher ratio coefficient and the F-statistic?
b)Next,two explanatory variables,the percent of English learners (EL_PCT)and expenditures per student (EXPN_STU)are added.The output is listed as below.What is the relationship between the three t-statistics for the slopes and the homoskedasticity-only F-statistic now?
Dependent Variable: TESTSCR
Method: Least Squares
Date: 07/30/06 Time: 17:55
Sample: 1 420
Included observations: 420 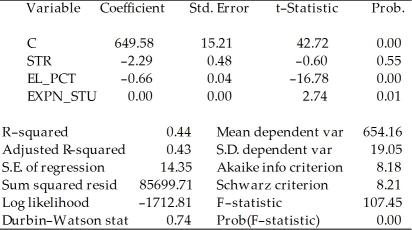
Correct Answer:

Verified
(a)The F-statistic tests the null hypoth...View Answer
Unlock this answer now
Get Access to more Verified Answers free of charge
Correct Answer:
Verified
View Answer
Unlock this answer now
Get Access to more Verified Answers free of charge
Q9: When testing the null hypothesis that two
Q10: Attendance at sports events depends on various
Q11: Consider the following two models to explain
Q12: Consider the following regression output for an
Q12: If you reject a joint null hypothesis
Q13: All of the following are correct formulae
Q15: Set up the null hypothesis and alternative
Q17: The following linear hypothesis can be tested
Q18: In the multiple regression model,the t-statistic for
Q19: The F-statistic with q = 2 restrictions