Essay
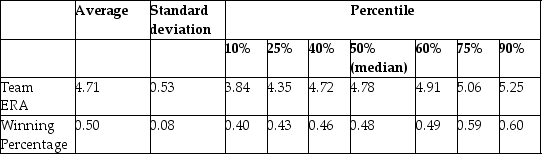
The baseball team nearest to your home town is,once again,not doing well.Given that your knowledge of what it takes to win in baseball is vastly superior to that of management,you want to find out what it takes to win in Major League Baseball (MLB).You therefore collect the winning percentage of all 30 baseball teams in MLB for 1999 and regress the winning percentage on what you consider the primary determinant for wins,which is quality pitching (team earned run average).You find the following information on team performance:
Summary of the Distribution of Winning Percentage and
Team Earned Run Average for MLB in 1999
 (a)What is your expected sign for the regression slope? Will it make sense to interpret the intercept? If not,should you omit it from your regression and force the regression line through the origin?
(b)OLS estimation of the relationship between the winning percentage and the team ERA yield the following:  = 0.9 - 0.10 × teamera ,R2=0.49,SER = 0.06,
where winpct is measured as wins divided by games played,so for example a team that won half of its games would have Winpct = 0.50.Interpret your regression results.
(c)It is typically sufficient to win 90 games to be in the playoffs and/or to win a division.Winning over 100 games a season is exceptional: the Atlanta Braves had the most wins in 1999 with 103.Teams play a total of 162 games a year.Given this information,do you consider the slope coefficient to be large or small?
(d)What would be the effect on the slope,the intercept,and the regression R2 if you measured Winpct in percentage points,i.e. ,as (Wins/Games)× 100?
(e)Are you impressed with the size of the regression R2? Given that there is 51% of unexplained variation in the winning percentage,what might some of these factors be?
Correct Answer:

Verified
(a)You expect a negative relationship,si...View Answer
Unlock this answer now
Get Access to more Verified Answers free of charge
Correct Answer:
Verified
View Answer
Unlock this answer now
Get Access to more Verified Answers free of charge
Q1: Prove that the regression R2 is identical
Q2: Assume that there is a change in
Q3: Your textbook presented you with the following
Q5: The regression R2 is defined as follows:<br>A)
Q6: Indicate in a scatterplot what the data
Q7: In order to calculate the slope,the intercept,and
Q8: (Requires Calculus)Consider the following model:<br>Yi = β0
Q9: Sir Francis Galton,a cousin of James Darwin,examined
Q10: If the three least squares assumptions hold,then
Q11: The normal approximation to the sampling distribution