Essay
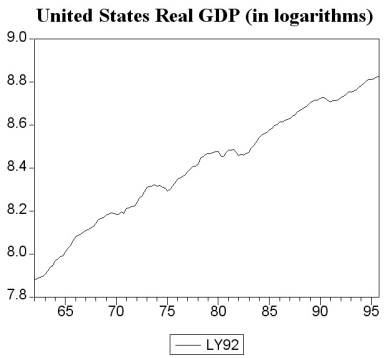
The following two graphs give you a plot of the United States aggregate unemployment rate for the sample period 1962:I to 1999:IV,and the (log)level of real United States GDP for the sample period 1962:I to 1995:IV.You want test for stationarity in both cases.Indicate whether or not you should include a time trend in your Augmented Dickey-Fuller test and why. 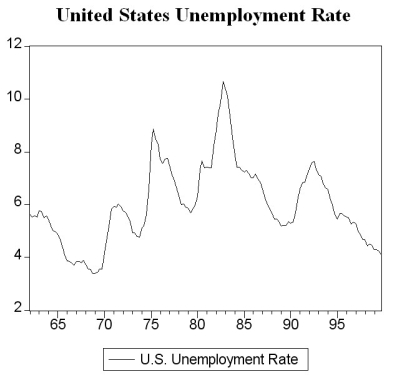
Correct Answer:

Verified
Looking over the entire sample period,th...View Answer
Unlock this answer now
Get Access to more Verified Answers free of charge
Correct Answer:
Verified
View Answer
Unlock this answer now
Get Access to more Verified Answers free of charge
Q2: An autoregression is a regression<br>A)of a dependent
Q13: The Granger Causality Test<br>A)uses the F-statistic to
Q14: The Times Series Regression with Multiple Predictors<br>A)is
Q15: One reason for computing the logarithms (ln),
Q25: Problems caused by stochastic trends include all
Q28: The root mean squared forecast error (RMSFE)is
Q31: You have collected data for real GDP
Q32: The BIC is a statistic<br>A)commonly used to
Q33: The textbook displayed the accompanying four economic
Q34: One of the sources of error in