Essay
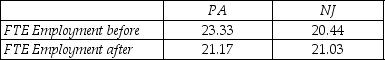
Let the vertical axis of a figure indicate the average employment fast food restaurants.There are two time periods,t = 1 and t = 2,where time period is measured on the horizontal axis.The following table presents average employment levels per restaurant for New Jersey (the treatment group)and Eastern Pennsylvania (the control group).
 Enter the four points in the figure and label them
  ,
,  ,
,  ,and
,and  .Connect the points.Finally calculate and indicate the value for
  .
.
Correct Answer:

Verified
 = Δ - Δ = (21.03 ...
View Answer
Unlock this answer now
Get Access to more Verified Answers free of charge
Correct Answer:
Verified
View Answer
Unlock this answer now
Get Access to more Verified Answers free of charge
Q2: The following is not a threat to
Q3: Assume that data are available on other
Q20: Heterogeneous population<br>A)implies that heteroskedasticity-robust standard errors must
Q21: Randomization based on covariates is<br>A)not of practical
Q23: In the context of a controlled experiment,consider
Q23: Quasi-experiments<br>A)provide a bridge between the econometric analysis
Q39: You want to study whether or not
Q42: Consider the simple population regression model where
Q45: Present alternative estimators for causal effects using
Q48: Specify the multiple regression model that contains