Essay
A study analyzed the probability of Major League Baseball (MLB)players to "survive" for another season,or,in other words,to play one more season.The researchers had a sample of 4,728 hitters and 3,803 pitchers for the years 1901-1999.All explanatory variables are standardized.The probit estimation yielded the results as shown in the table:
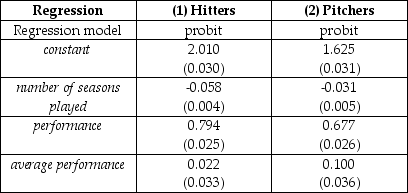 where the limited dependent variable takes on a value of one if the player had one more season (a minimum of 50 at bats or 25 innings pitched),number of seasons played is measured in years,performance is the batting average for hitters and the earned run average for pitchers,and average performance refers to performance over the career.
(a)Interpret the two probit equations and calculate survival probabilities for hitters and pitchers at the sample mean.Why are these so high?
(b)Calculate the change in the survival probability for a player who has a very bad year by performing two standard deviations below the average (assume also that this player has been in the majors for many years so that his average performance is hardly affected).How does this change the survival probability when compared to the answer in (a)?
(c)Since the results seem similar,the researcher could consider combining the two samples.Explain in some detail how this could be done and how you could test the hypothesis that the coefficients are the same.
Correct Answer:

Verified
(a)Note that all variables are standardi...View Answer
Unlock this answer now
Get Access to more Verified Answers free of charge
Correct Answer:
Verified
View Answer
Unlock this answer now
Get Access to more Verified Answers free of charge
Q3: The probit model<br>A)is the same as the
Q11: The binary dependent variable model is an
Q13: Nonlinear least squares<br>A)solves the minimization of the
Q20: When having a choice of which estimator
Q27: Equation (11.3)in your textbook presents the regression
Q28: When testing joint hypothesis, you can use<br>A)the
Q28: The Report of the Presidential Commission on
Q29: The following tools from multiple regression analysis
Q32: In the expression Pr(Y = 1 <img
Q34: In the probit model Pr(Y = 1