Multiple Choice
The following histogram shows the distribution of 1000 sample observations from a population with a mean of = 4 and a variance of 2 = 8. 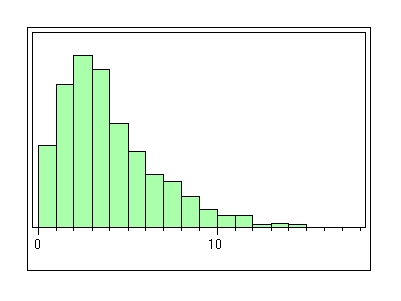 Suppose a simple random sample of 100 observations is to be selected from the population and the sample average
  is calculated.Which of the following statements about the distribution of
  is/are FALSE?
A) The distribution of  will have a mean of 4.
B) The distribution  will be approximately Normal.
C) Because the distribution shown in the histogram above is clearly skewed to the right,the shape of the distribution of  will also show skewness to the right.
D) Even though the distribution of the population variable appears to be skewed to the right,the distribution of  will be approximately symmetric around = 4.
E) The standard deviation of the distribution of  will be 0.283.
Correct Answer:

Verified
Correct Answer:
Verified
Q24: A news program is doing a report
Q25: Birth weights of babies born to full-term
Q26: A study,conducted by Jackson et al.and published
Q27: The proportion of supermarket customers who do
Q28: A public opinion poll in Ohio wants
Q30: The proportion of supermarket customers who do
Q31: Binomial distributions represent _ random variables.<br>A)discrete<br>B)continuous<br>C)None of
Q32: A study,conducted by Jackson et al.and published
Q33: Every year around Christmas time,many parents take
Q34: A study,conducted by Jackson et al.and published