True/False
The scatterplot below displays data collected from 20 adults on their age and overall GPA at graduation. 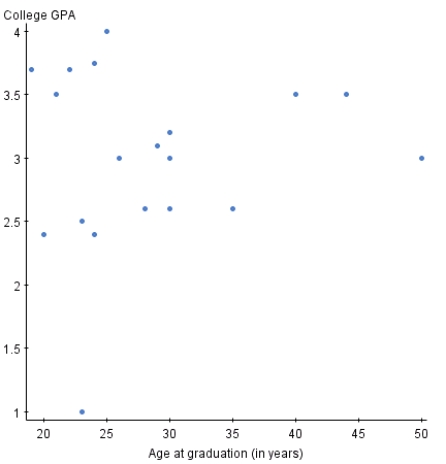
If you switched the variables on the x and y axis,the relationship between the two variables would appear much stronger.
Correct Answer:

Verified
Correct Answer:
Verified
Q1: A categorical variable can be added to
Q2: Malaria is a leading cause of infectious
Q3: Fill in the blank.A study is conducted
Q4: Two variables are positively associated when _.<br>A)above-average
Q6: Volunteers for a research study were divided
Q7: Which of the following statements is/are FALSE?<br>A)A
Q8: We are interested in determining if students
Q9: Fill in the blank.A researcher is interested
Q10: To examine the relationship between two variables,the
Q11: Variables measured on the same cases are