Multiple Choice
Parts manufactured by an injection molding process are subjected to a compressive strength test.We wish to monitor the compressive strength of the parts manufactured by this process using both  and s charts.Samples of size 9 are to be taken at regular intervals,and their mean compressive strength (in psi = pounds per square inch) and standard deviation are plotted on the charts in time order.The target values for the compressive strengths are a mean of = 80 psi and a standard deviation of = 3 psi.The control chart constants are (partially) reproduced below.
 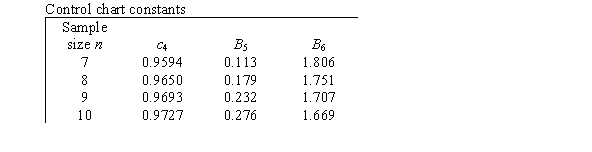 What is the center line for the s chart?
A) 0.7 psi
B) 2.9 psi
C) 3 psi
D) 5.1 psi
Correct Answer:

Verified
Correct Answer:
Verified
Q75: Suppose you are the owner of a
Q76: You have been invited to give a
Q77: A statistic Q is to be used
Q78: Which of the control charts is out
Q79: At the start of the semester,a professor
Q81: The 68-95-99.7 rule tells us that if
Q82: An important characteristic in the proper operation
Q83: What do we call the ability of
Q84: Piston rings for an automotive engine are
Q85: A p chart is a control chart