Multiple Choice
The data below represent the means from 15 sample control charts for the amount of time in minutes it takes students to complete a quiz in a basic statistics course.The same quiz was given to 15 different sections of a basic statistics course.Five students were sampled from each class and each mean is shown below. 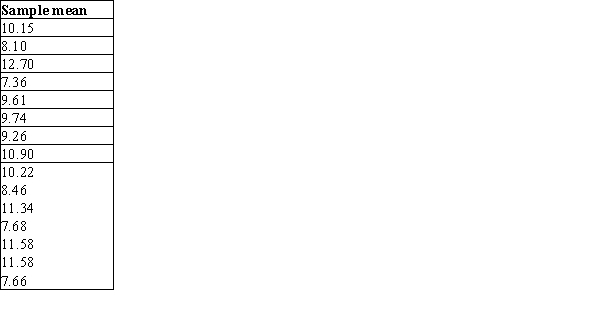 What is the value of the upper control limit?
A) 16.71
B) 2.83
C) 9.77
D) None of the above
Correct Answer:

Verified
Correct Answer:
Verified
Q25: Which of the following is true about
Q26: An important characteristic in the proper operation
Q27: Suppose we use a "run of eight"
Q28: Piston rings for an automotive engine are
Q29: In an electronics company that produces transistors,1000
Q31: Which of the following statements about the
Q32: In an electronics company that produces transistors,1000
Q33: What is an R chart used for?<br>A)To
Q34: A control chart on a process characteristic
Q35: Piston rings for an automotive engine are