Multiple Choice
Parts manufactured by an injection molding process are subjected to a compressive strength test.We monitor the compressive strength of the parts manufactured by this process using an  and an s control chart.Samples of size 9 are taken at regular intervals,and their mean compressive strength (in psi = pounds per square inch) and standard deviation are plotted on the charts in time order.The overall mean of the sample means is
  = 81.2 psi,and the mean of the sample standard deviations is
  = 2.9 psi.The control chart constants are (partially) reproduced below.
 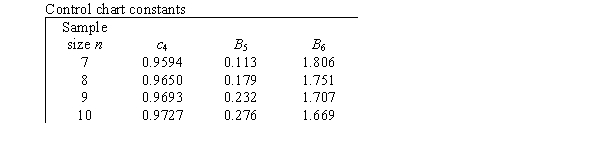 What is the center line for the s chart?
A) 2.8 psi
B) 2.9 psi
C) 3 psi
D) 5.0 psi
Correct Answer:

Verified
Correct Answer:
Verified
Q40: A bank is interested in improving the
Q41: What is the definition of rational subgroups?<br>A)They
Q42: An important characteristic in the proper operation
Q43: It is said that "the first step
Q44: Parts manufactured by an injection molding process
Q46: What is the name of a chart
Q47: A random sample of items was selected
Q48: Which of the following is an example
Q49: A variable is measured periodically on a
Q50: You have been invited to give a