Multiple Choice
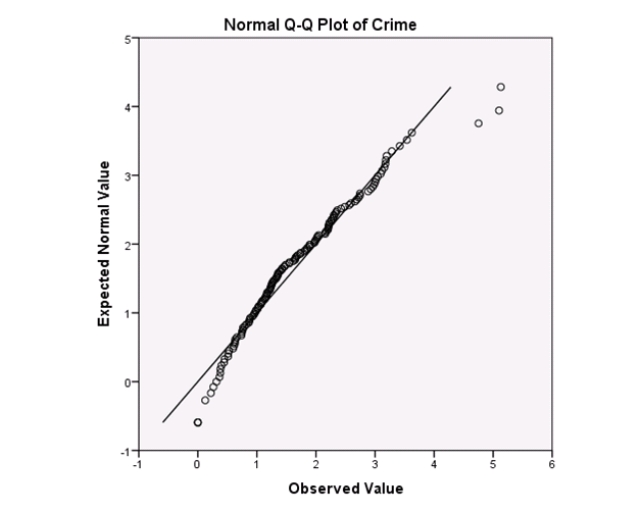
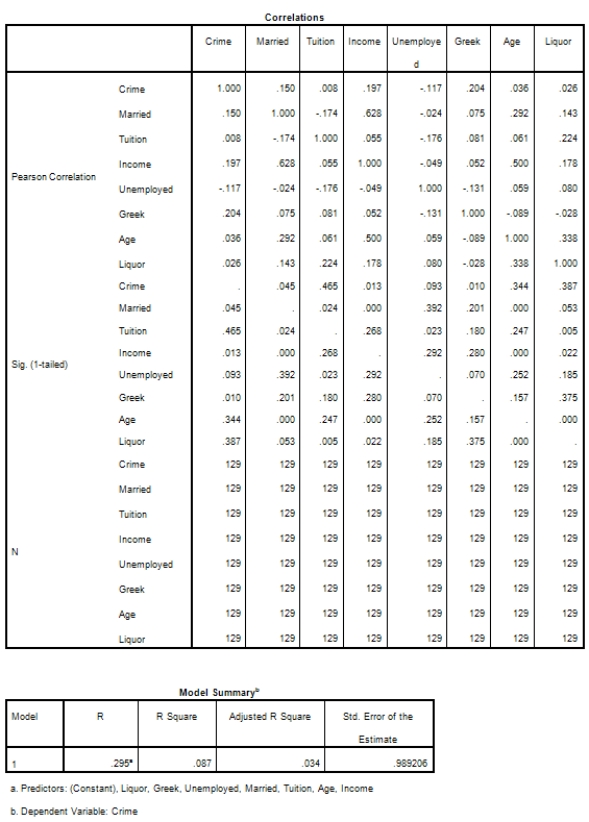
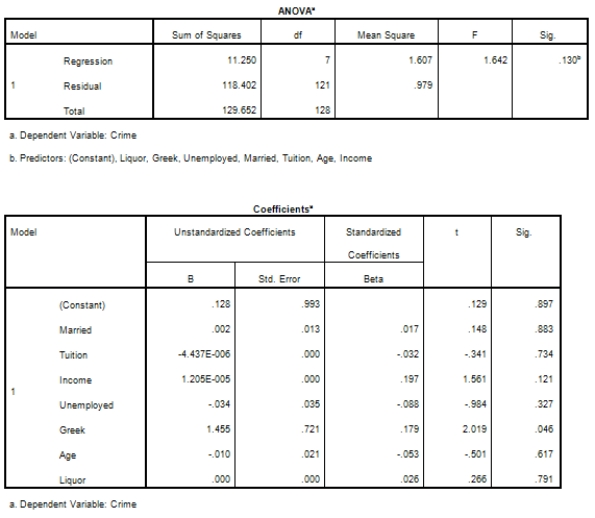
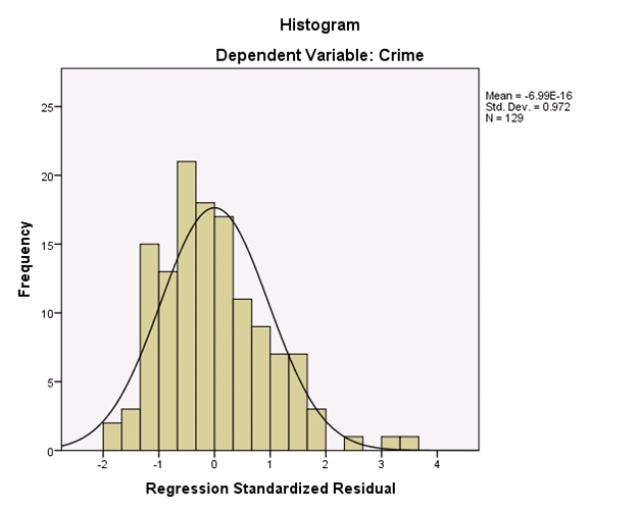
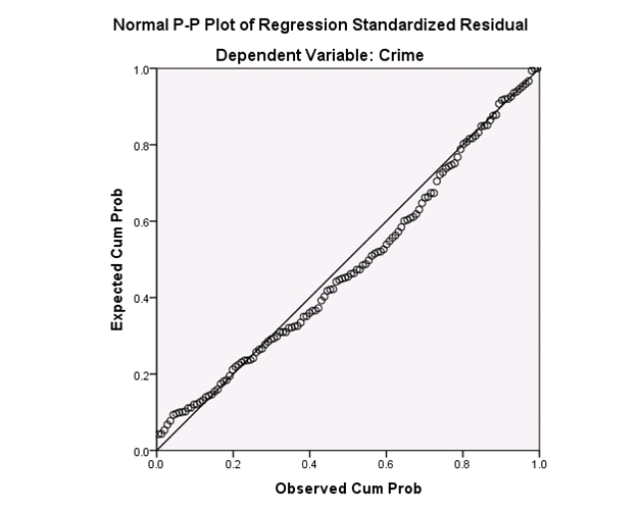
Campus crime rates are generally lower than the national average;however thousands of crimes take place on college campuses daily.Cities that are notoriously dangerous would likely be undesirable locations for a college campus.A study examined the crime rates on campuses throughout the United States and whether or not they were significantly affected by surrounding cities.A regression analysis was performed to investigate which characteristics of a city,along with a few chosen demographics of a school,impacted the crime rate on a college campus.There are over 4000 colleges and universities in the United States.The study included a random sample of 129 institutions.The response variable was the number of crimes per 1000 people.Explanatory variables included the percent of married couples in the city (married) ,tuition of the university (tuition) ,average income of the city (income) ,unemployment rate of the city (unemployment) ,percent of students who belong to a fraternity or sorority (Greek) ,average age of the students at the university (age) ,and number of liquor stores in the city (liquor) .A complete analysis of the data is shown below. 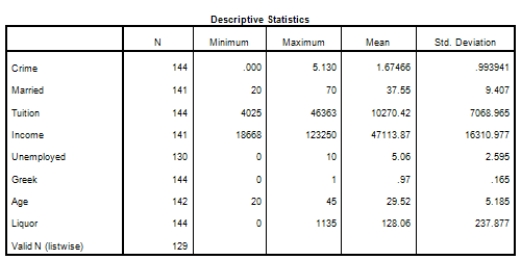
 What should be done to examine the relationship between every pair of variables more closely?
A) Examine the 36 scatterplots that represent every pairwise relationship.
B) Examine the 26 scatterplots that represent every pairwise relationship.
C) Examine side-by-side boxplots of all the 9 variables in the model.
D) Examine a histogram of all the 9 variables in the model.
Correct Answer:

Verified
Correct Answer:
Verified
Q5: The NFL keeps track of a large
Q6: The variable mood takes on the values
Q7: The data referred to in this question
Q8: A researcher is investigating possible explanations for
Q9: The NFL keeps track of a large
Q11: In multiple regression,a small P-value from the
Q12: A study was conducted on 40 different
Q13: The data referred to in this question
Q14: In a multiple regression with three explanatory
Q15: In this experiment,the risk-taking propensity of 90