Multiple Choice
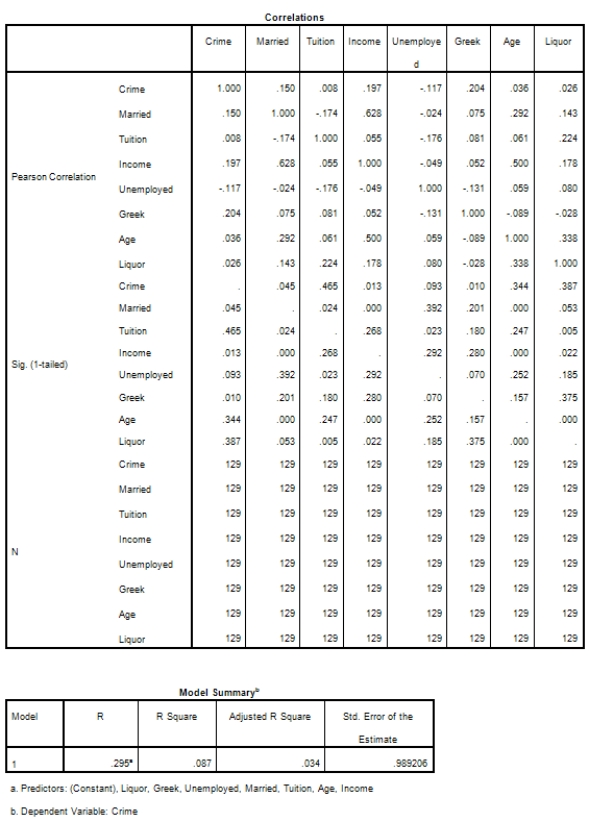
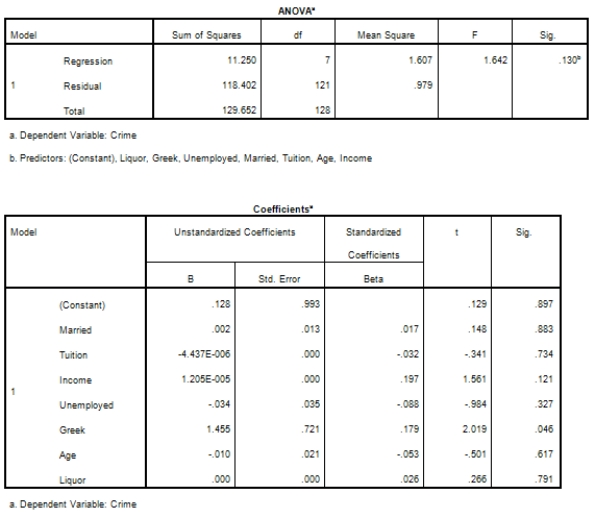
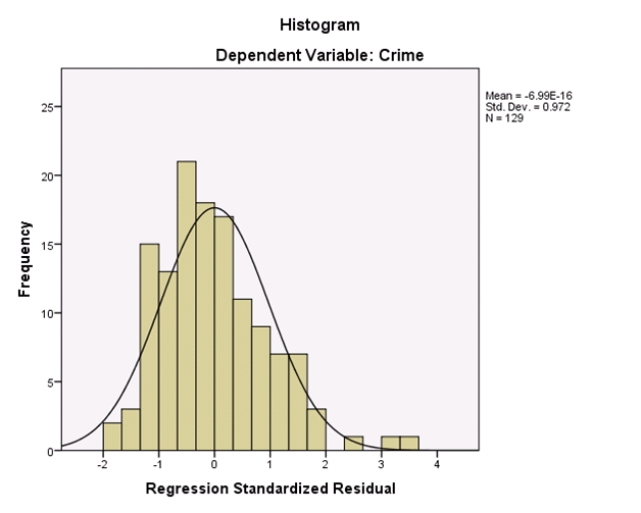
Campus crime rates are generally lower than the national average;however thousands of crimes take place on college campuses daily.Cities that are notoriously dangerous would likely be undesirable locations for a college campus.A study examined the crime rates on campuses throughout the United States and whether or not they were significantly affected by surrounding cities.A regression analysis was performed to investigate which characteristics of a city,along with a few chosen demographics of a school,impacted the crime rate on a college campus.There are over 4000 colleges and universities in the United States.The study included a random sample of 129 institutions.The response variable was the number of crimes per 1000 people.Explanatory variables included the percent of married couples in the city (married) ,tuition of the university (tuition) ,average income of the city (income) ,unemployment rate of the city (unemployment) ,percent of students who belong to a fraternity or sorority (Greek) ,average age of the students at the university (age) ,and number of liquor stores in the city (liquor) .A complete analysis of the data is shown below. 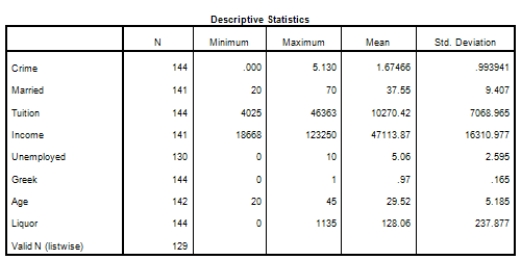
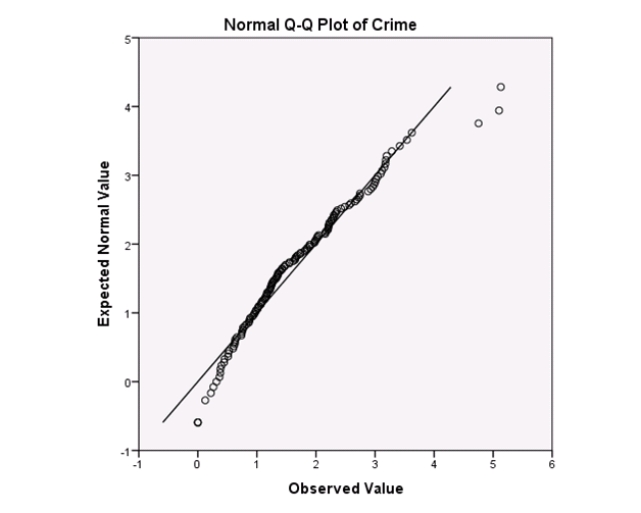
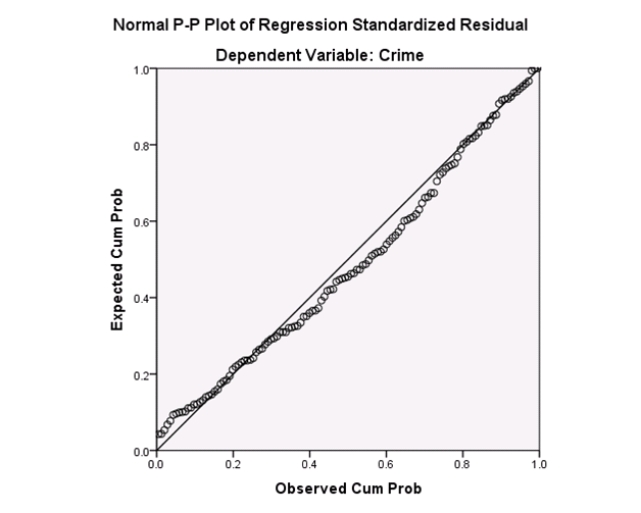 Examine the Q-Q plot of the residuals.What do you notice?
A) The Q-Q plot indicates some deviations from Normality,which could invalidate the analyses.
B) The residuals appear Normal;therefore,the regression results are accurate.
C) The residuals should be checked using a boxplot instead of a Q-Q plot.Not enough information can be obtained from the Q-Q plot.
D) One cannot obtain any information about the model from the residuals.
Correct Answer:

Verified
Correct Answer:
Verified
Q17: The data referred to in this question
Q18: Researchers at a large nutrition and weight
Q19: In this experiment,the risk-taking propensity of 90
Q20: In this experiment,the risk-taking propensity of 90
Q21: Based on a sample of the salaries
Q23: A study was conducted on 40 different
Q24: Suppose you want to perform a multiple
Q25: In this experiment,the risk-taking propensity of 90
Q26: In this experiment,the risk-taking propensity of 90
Q27: A researcher is investigating possible explanations for