Multiple Choice
As in most professional sports,statistics are collected in the National Hockey League.In the 2006-2007 season,teams played 82 games.A team was awarded 2 points for a win and 1 point if the game was tied at the end of regulation time but then lost in overtime.For each of the 30 teams,data on the number of goals scored per game (Goals/G) and the percentage of the 164 possible points they won (Win%) during the season were collected.The following graph shows the plotted points for the variables Win% and Goals/G and the simple linear regression line fitted using least squares. 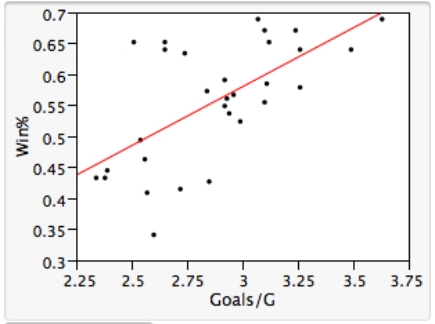 From the computer output for the least-squares fit,the estimated equation was found to be
  ,
,  = 0.398,and
  = 60.29.Also,it was determined from the output that
  = 12.800 and
  = 4.418. Which of the following statements is/are FALSE?
A) An amount of 39.8% of the variation in the winning percent variable is explained by the least-squares regression on the number of goals scored per game.
B) An increase of 1 goal per game results in an increase of about 19% in winning percent.
C) If a team scores 3 goals per game,we would predict the team would have a Win% of 55%.
D) The Ottawa Senators scored 3.49 goals per game and their Win% was 64.0.The residual for Ottawa was then -3.32.
E) The mean value of the Win% variable is 0.932 when the Goals/G is 0.
Correct Answer:

Verified
Correct Answer:
Verified
Q48: A random sample of 79 companies from
Q49: The statistical model for simple linear regression
Q50: A recent study was done to assess
Q51: The following scatter plot and SPSS output
Q52: There is an old saying in golf:
Q54: The moisture in a wet mix of
Q55: As in most professional sports,statistics are collected
Q56: Prediction intervals are usually wider,narrower,or the same
Q57: A recent study was done to assess
Q58: The moisture in a wet mix of