Multiple Choice
As in most professional sports,statistics are collected in the National Hockey League.In the 2006-2007 season,teams played 82 games.A team was awarded 2 points for a win and 1 point if the game was tied at the end of regulation time but then lost in overtime.For each of the 30 teams,data on the number of goals scored per game (Goals/G) and the percentage of the 164 possible points they won (Win%) during the season were collected.The following graph shows the plotted points for the variables Win% and Goals/G and the simple linear regression line fitted using least squares. 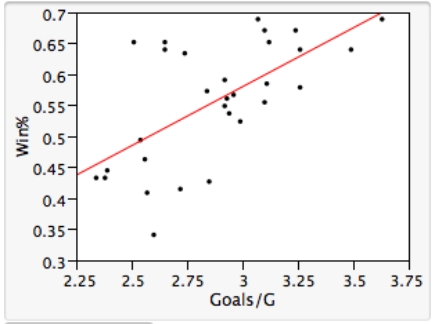 From the computer output for the least-squares fit,the estimated equation was found to be
  ,
,  = 0.398,and
  = 60.29.Also,it was determined from the output that
  = 12.800 and
  = 4.418. A plot of the residuals from the least-squares fit against the Goals/G variable is shown below.
 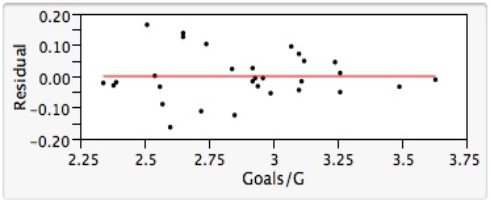 What statements about residuals and/or about this residual plot is/are FALSE?
A) There does not appear to be any particular pattern to the residuals on the plot.
B) The residual plot shows that the residuals do approximately follow a Normal distribution,as the statistical model requires.
C) Residuals from a least-squares fit in simple linear regression always sum to zero.
D) None of the residuals look as though they would be considered to be outliers.
E) The residuals appear to vary randomly about their mean of zero.
Correct Answer:

Verified
Correct Answer:
Verified
Q10: The moisture in a wet mix of
Q11: The moisture in a wet mix of
Q12: What is an approximate 95% confidence interval
Q13: A recent study was done to assess
Q14: Do heavier cars use more gasoline? To
Q16: The moisture in a wet mix of
Q17: Which of the following statements about simple
Q18: There is an old saying in golf:
Q19: The statistical model for simple linear regression
Q20: A recent study was done to assess