Essay
The following scatter plot and SPSS output represent data collected on 89 middle-aged people.The relationship between body weight and percent body fat is to be studied. 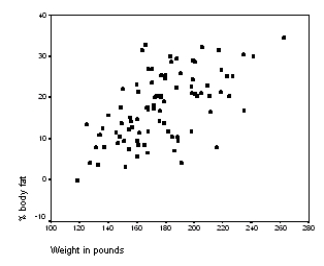
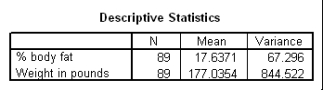
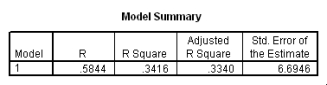
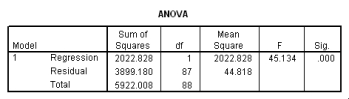
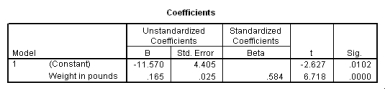 What is the equation of the least-squares regression line?
Correct Answer:

Verified
Correct Answer:
Verified
Related Questions
Q34: The data referred to in this question
Q35: A random sample of 79 companies from
Q36: The following scatter plot and SPSS output
Q37: The data referred to in this question
Q38: A study was conducted to monitor the
Q40: The statistical model for simple linear regression
Q41: Suppose we are given the following information:
Q42: Do heavier cars use more gasoline? To
Q43: The statistical model for linear regression can
Q44: A recent study was done to assess