Essay
The following scatter plot and SPSS output represent data collected on 89 middle-aged people.The relationship between body weight and percent body fat is to be studied. 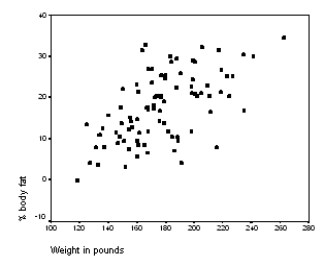
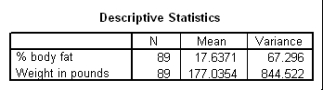
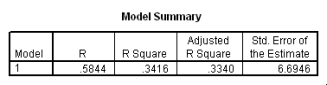
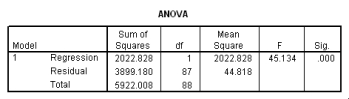
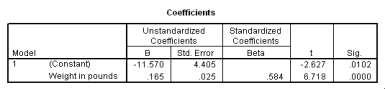 Let be the population correlation between body fat and body weight.What is the value of the t statistic for testing the hypotheses H0: = 0 versus Ha: 0?
Correct Answer:

Verified
Correct Answer:
Verified
Q1: A recent study was done to assess
Q2: The statistical model for simple linear regression
Q3: A study was conducted to monitor the
Q4: The data referred to in this question
Q5: A random sample of 79 companies from
Q7: An interval used to predict a future
Q8: Do heavier cars use more gasoline? To
Q9: The data referred to in this question
Q10: The moisture in a wet mix of
Q11: The moisture in a wet mix of