Multiple Choice
The histogram below shows data from 30 students who were asked,"How much time do you spend on the Internet in minutes?" What are some features about the data? 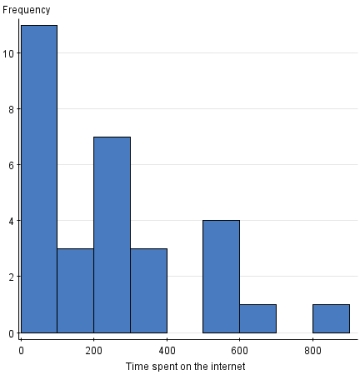
A) There is a potential outlier.
B) Most values are around 800.
C) The range of values is between 0 and 400.
D) None of the above
Correct Answer:

Verified
Correct Answer:
Verified
Q100: The Insurance Institute for Highway Safety publishes
Q101: Malaria is a leading cause of infectious
Q102: The World Malaria Report (2008)has information on
Q103: The bar graph below represents the highest
Q104: A nationwide study was done to assess
Q106: The asking prices (in thousands of dollars)for
Q107: During the early part of the 1994
Q108: According to the American Cancer Society,the decline
Q109: On the first day of class,statistics professors
Q110: Suppose you own a pizza delivery company