Multiple Choice
The timeplot below gives the number of burglaries committed each month for a city in Ohio.The plot is for the three-year period of January 1987 to December 1989. 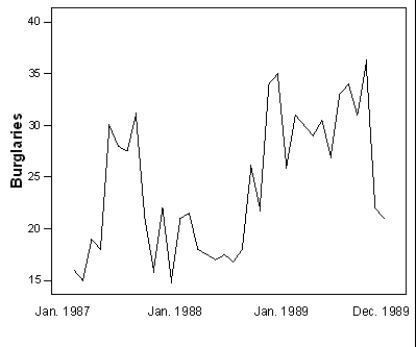 What is approximately the number of burglaries in December 1989,the last date recorded in the timeplot?
A) 22
B) 27
C) 32
D) 37
Correct Answer:

Verified
Correct Answer:
Verified
Q94: The Insurance Institute for Highway Safety publishes
Q95: When making a stemplot,it is appropriate to
Q96: The ages (to the nearest year)of the
Q97: A type of variable where arithmetic operations
Q98: The median age of five people in
Q100: The Insurance Institute for Highway Safety publishes
Q101: Malaria is a leading cause of infectious
Q102: The World Malaria Report (2008)has information on
Q103: The bar graph below represents the highest
Q104: A nationwide study was done to assess