Multiple Choice
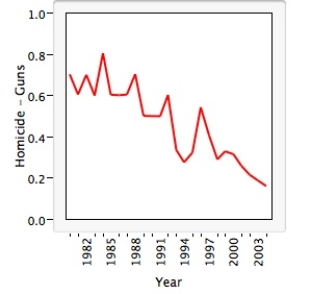
Statistics were gathered on the number of homicides committed with guns in Australia in the years from 1980 to 2004.From these data the following graph was constructed.  This plot is a graph of a(n) _____________,and it shows that there is/are ___________ in the data.
A) categorical variable;skewness to the right
B) histogram;multiple peaks
C) line;an increasing trend
D) quantitative variable;outlier values
E) time series;a decreasing trend
Correct Answer:

Verified
Correct Answer:
Verified
Q16: The distribution of a categorical variable is
Q17: Which of the following variables is categorical?<br>A)The
Q18: In a statistics class with 136 students,the
Q19: The following boxplot is of the birth
Q20: A researcher reports that,on average,the participants in
Q22: A study is being conducted on air
Q23: When making a stemplot,it is appropriate to
Q24: Consider the following data which describe the
Q25: A consumer group surveyed the prices for
Q26: Variables that take numeric values for which