Multiple Choice
The bar graph below represents the highest education level achieved for 30 random females and 60 random males questioned on a street in downtown Washington,DC. 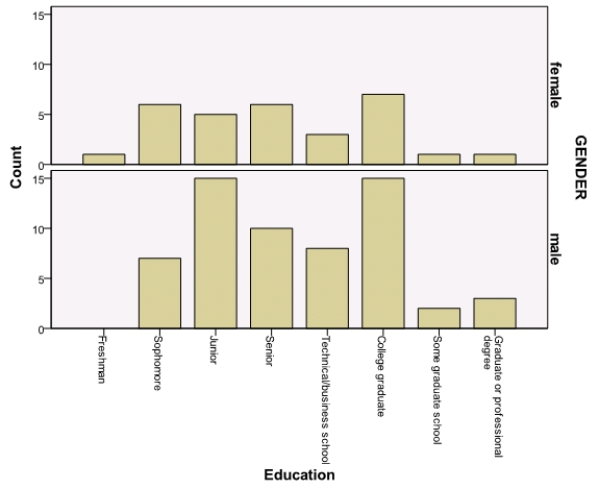 What percentage of women completed at most their junior year?
A) 5%
B) 17%
C) 67%
D) 100%
Correct Answer:

Verified
Correct Answer:
Verified
Q76: The World Malaria Report (2008)has information on
Q77: Quantitative variables are best displayed using _.<br>A)stemplots<br>B)pie
Q78: Below is a data set with information
Q79: The following boxplot is of the birth
Q80: In a statistics class with 136 students,the
Q82: During the early part of the 1994
Q83: The bar graph below represents the highest
Q84: The Michigan Department of Transportation (M-DOT)is working
Q85: In a statistics class with 136 students,the
Q86: Which of the following variables is quantitative?<br>A)The