Multiple Choice
The bar graph below represents the highest education level achieved for 30 random females and 60 random males questioned on a street in downtown Washington,DC. 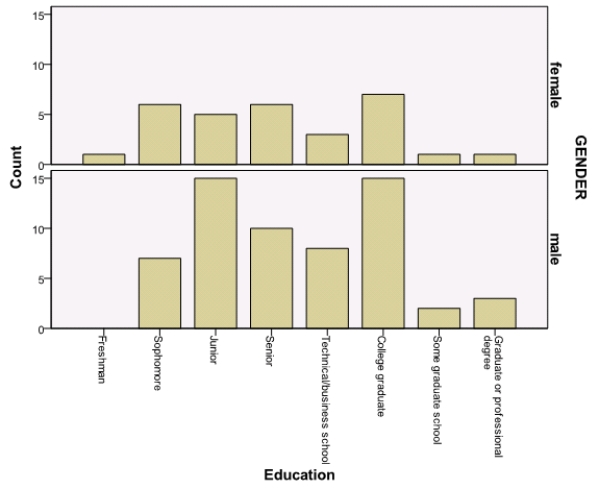 How many males completed at least some graduate school?
A) 5
B) 2
C) 3
D) 60
Correct Answer:

Verified
Correct Answer:
Verified
Q60: We have a data set where the
Q61: A variable is a characteristic of a<br>A)case.<br>B)label.<br>C)value.<br>D)None
Q62: The World Malaria Report (2008)has information on
Q63: In a statistics class with 136 students,the
Q64: Categorical variables are best displayed by _.<br>A)histograms<br>B)pie
Q66: Consider the following data which describe the
Q67: The histogram below represents the height (in
Q68: Malaria is a leading cause of infectious
Q69: The following stemplot displays the number of
Q70: Below is a data set with information