Short Answer
A graphical representation of a linear program is shown below. The shaded area represents the feasible region, and the dashed line in the middle is the slope of the objective function. 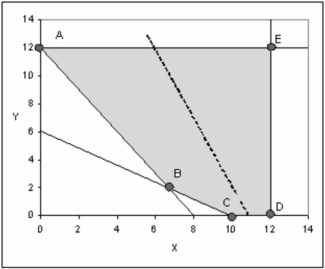
If this is a minimization, which extreme point is the optimal solution?
Correct Answer:

Verified
Correct Answer:
Verified
Q50: A parameter is a numerical value in
Q51: Surplus variables are only associated with minimization
Q52: The _ property of linear programming models
Q53: The production manager for the Coory soft
Q54: The _ property of linear programming models
Q56: The minimization of cost or maximization of
Q57: A graphical representation of a linear program
Q58: The best feasible solution is _.
Q59: Multiple optimal solutions provide _ flexibility to
Q60: The _ property of linear programming models