Multiple Choice
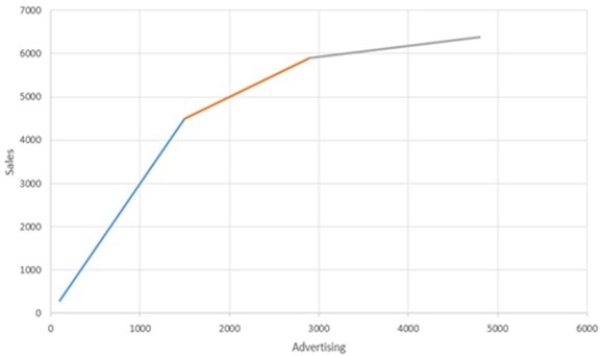
The following chart shows a relationship between advertising expenditures and sales. 
Which of the following describes the chart in terms of a linear relationship?
A) The chart shows a linear relationship.
B) The chart shows increasing marginal returns.
C) The chart shows a proportional relationship.
D) The chart shows discontinuities.
E) The chart is piecewise linear.
Correct Answer:

Verified
Correct Answer:
Verified
Q25: Note: This problem requires Excel.<br>A firm
Q26: Evolutionary Solver is often faster than the
Q27: If the RSPE Model Analysis indicates that
Q28: If the slope of a graph never
Q29: Which of the following profit functions has
Q31: After some experimentation, you have observed
Q32: Evolutionary Solver is best suited to which
Q33: Excel's curve fitting method is used to
Q34: If the RSPE Model Analysis indicates that
Q35: Which of the following statements about Solver's