Multiple Choice
The figure below shows the nodes (A-I) and capacities (labelled on arcs in TB/s) of a computer network. The firm would like to know how much information can flow from node A to node I. 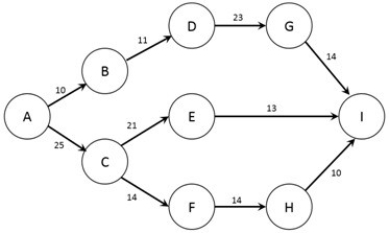 Which nodes are the sink and source for this problem?
A) Node A is the sink, Node I is the source.
B) Node A is the sink, Node B is the source.
C) Node B is the sink, Node I is the source.
D) Node B is the source, Node I is the sink.
E) Node A is the source, Node I is the sink.
Correct Answer:

Verified
Correct Answer:
Verified
Q34: In a minimum cost flow problem there
Q35: The figure below shows the possible routes
Q36: The source and sink of a maximum
Q37: The figure below shows the nodes (A-I)
Q38: Network representations can be used for the
Q40: In a shortest path problem, when "real
Q41: The figure below shows the nodes (A-I)
Q42: The figure below shows the nodes (A-I)
Q43: All network optimization problems actually are special
Q44: The figure below shows the possible routes