Multiple Choice
The figure below shows the nodes (A-I) and capacities (labelled on arcs in TB/s) of a computer network. The firm would like to know how much information can flow from node A to node I. 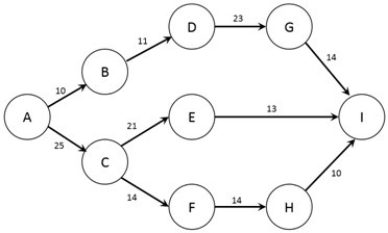 Note: This question requires Solver.
Formulate the problem in Solver and find the optimal solution. What is the maximum amount of data that can be transmitted from node A to node I?
A) 13 TB/s
B) 23 TB/s
C) 33 TB/s
D) 43 TB/s
E) 53 TB/s
Correct Answer:

Verified
Correct Answer:
Verified
Q50: As long as all its supplies and
Q51: The figure below shows the nodes (A-I)
Q52: A minimum cost flow problem is a
Q53: Which of the following will have negative
Q54: In a maximum flow problem, the source
Q56: Which of the following is an application
Q57: What is the objective of a maximum
Q58: A manufacturing firm has three plants
Q59: Which of the following can be used
Q60: A manufacturing firm has four plants