Multiple Choice
The figure below shows the nodes (A - I) and capacities (labelled on arcs in packages/day) of a shipping network. The firm would like to know how many packages per day can flow from node A to node I. 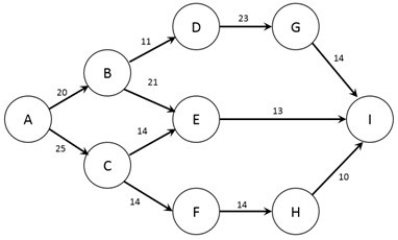 Note: This question requires Solver.
Formulate the problem in Solver and find the optimal solution. What is the maximum amount of data that can be transmitted from node A to node I?
A) 13 packages/day.
B) 23 packages/day.
C) 34 packages/day.
D) 43 packages/day.
E) 53 packages/day.
Correct Answer:

Verified
Correct Answer:
Verified
Q17: In a maximum flow problem, flow is
Q18: A network model showing the geographical layout
Q19: The figure below shows the possible routes
Q20: The figure below shows the possible routes
Q21: A minimum cost flow problem will have
Q23: When reformulating a shortest path problem as
Q24: A transportation problem is just a minimum
Q25: A manufacturing firm has three plants
Q26: Which of the following is not an
Q27: The amount of flow that is eventually