Essay
Demographic Variables and TV Narrative
A statistician wanted to determine if the demographic variables of age, education, and income influence the number of hours of television watched per week. A random sample of 25 adults was selected to estimate the multiple regression model:  , where y is the number of hours of television watched last week,
  is the age (in years),
  is the number of years of education, and
  is income (in $1000s). The computer output is shown below.
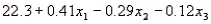
The regression equation is 
 S = 4.51 R-Sq = 34.8%
Analysis of Variance 
-Refer to Demographic Variables and TV Narrative. Is there sufficient evidence at the 1% significance level to indicate that hours of television watched and age are linearly related? Justify your conclusion.
Correct Answer:

Verified
 vs. 0
vs. 0
Rejection region: | t | > 2.83...View Answer
Unlock this answer now
Get Access to more Verified Answers free of charge
Correct Answer:
Verified
Rejection region: | t | >
View Answer
Unlock this answer now
Get Access to more Verified Answers free of charge
Q3: A coefficient of multiple correlation is a
Q71: What is stepwise regression, and when is
Q140: One of the consequences of multicollinearity in
Q147: A multiple regression model forms a plane
Q222: In a multiple regression model, adding more
Q223: Electric Usage Narrative<br>The power company claims the
Q225: Assume that a company is tracking its
Q229: Demographic Variables and TV Narrative<br>A statistician wanted
Q231: In testing the significance of a multiple
Q232: College Textbook Sales Narrative<br>A publisher of college