Essay
Demographic Variables and TV Narrative
A statistician wanted to determine if the demographic variables of age, education, and income influence the number of hours of television watched per week. A random sample of 25 adults was selected to estimate the multiple regression model:  , where y is the number of hours of television watched last week,
  is the age (in years),
  is the number of years of education, and
  is income (in $1000s). The computer output is shown below.
The regression equation is 
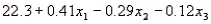
 S = 4.51 R-Sq = 34.8%
Analysis of Variance 
-Refer to Demographic Variables and TV Narrative. Interpret the coefficient  .
.
Correct Answer:

Verified
 = 0.41. This tells us that, for each ad...
View Answer
Unlock this answer now
Get Access to more Verified Answers free of charge
Correct Answer:
Verified
View Answer
Unlock this answer now
Get Access to more Verified Answers free of charge
Q82: Consider a multiple regression model with three
Q190: In multiple regression models, which of the
Q191: A multiple regression analysis involving 3 independent
Q192: In a multiple regression analysis involving six
Q193: Demographic Variables and TV Narrative<br>A statistician wanted
Q194: A multiple regression equation includes five independent
Q197: It is appropriate to compute a correlation
Q198: A regression model of the form <img
Q199: Rocket Experiments Narrative<br>An engineer was investigating the
Q200: In a multiple linear regression model, <img