Essay
Demographic Variables and TV Narrative
A statistician wanted to determine if the demographic variables of age, education, and income influence the number of hours of television watched per week. A random sample of 25 adults was selected to estimate the multiple regression model:  , where y is the number of hours of television watched last week,
  is the age (in years),
  is the number of years of education, and
  is income (in $1000s). The computer output is shown below.
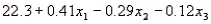
The regression equation is 
 S = 4.51 R-Sq = 34.8%
Analysis of Variance 
-Refer to Eating Habits of Canadians. How well does the model fit? Use any relevant statistics and diagnostic tools from the printout to answer this question.
Correct Answer:

Verified
From the statistical software printout, ...View Answer
Unlock this answer now
Get Access to more Verified Answers free of charge
Correct Answer:
Verified
View Answer
Unlock this answer now
Get Access to more Verified Answers free of charge
Q13: Qualitative predictor variables are entered into a
Q139: Having a large number of predictors in
Q147: College Textbook Sales Narrative<br>A publisher of college
Q148: Air Pollution Monitors Narrative<br>An experiment was designed
Q149: Life Expectancy Narrative<br>An actuary wanted to develop
Q151: A multiple regression analysis includes 25 data
Q153: In a regression setting, if you add
Q154: In constructing a multiple regression model with
Q155: Air Pollution Monitors Narrative<br>An experiment was designed
Q156: Suppose that one equation has three explanatory