Essay
Demographic Variables and TV Narrative
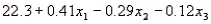
A statistician wanted to determine if the demographic variables of age, education, and income influence the number of hours of television watched per week. A random sample of 25 adults was selected to estimate the multiple regression model:  , where y is the number of hours of television watched last week,
  is the age (in years),
  is the number of years of education, and
  is income (in $1000s). The computer output is shown below.
The regression equation is 
 S = 4.51 R-Sq = 34.8%
Analysis of Variance 
-Refer to Eating Habits of Canadians. Use the printout to find a 95% confidence interval for the average beef consumption per family of three in 2005. What is the 95% prediction interval for the beef consumption per family of three in 2005? Is there any with the validity of the 95% confidence level for these intervals?
Correct Answer:

Verified
From the printout, the two int...View Answer
Unlock this answer now
Get Access to more Verified Answers free of charge
Correct Answer:
Verified
View Answer
Unlock this answer now
Get Access to more Verified Answers free of charge
Q41: If the confidence interval estimate for the
Q42: Multiple correlation analysis measures the overall strength
Q43: If the <img src="https://d2lvgg3v3hfg70.cloudfront.net/TB4962/.jpg" alt="If the
Q44: In a multiple regression model, the regression
Q45: How many dummy variables will you need
Q47: The adjusted multiple coefficient of determination is
Q48: Fuel Consumption and Horsepower<br>An automobile manufacturer would
Q49: Three qualitative variables need to be incorporated
Q50: A multiple regression model has the form
Q157: In general, on what basis are independent