Essay
Soft Drink Sales Narrative
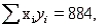
A soft drink distributor was interested in examining the relationship between the number of ads (x) for his product during prime time on a local television station and the number of sales per week (y) in 1000s of cases. She compiled the figures for 20 weeks and computed the following summary information: n = 20, 

 and
and  .
.
-Refer to Soft Drink Sales Narrative. Find the correlation coefficient for the number of ads during prime time and weekly sales.
Correct Answer:

Verified
Correct Answer:
Verified
Q9: Gender Differences Narrative<br>Male and female respondents to
Q10: Gender Differences Narrative<br>Male and female respondents to
Q12: Gasoline Prices and Fuel Efficiency Narrative.<br>When the
Q15: Meet Your Match Media Narrative<br>The Executive Board
Q16: Gasoline Prices and Fuel Efficiency Narrative.<br>When the
Q17: Which of the following values of the
Q19: Students' GPA Narrative<br>A law school administrator was
Q21: The best fitting line relating the dependent
Q23: If the correlation coefficient between the independent
Q71: A perfect correlation between two variables will